Nurturing AI Natives: How to Attract and Keep Your Best Builders from Leaving
In previous blog posts, we explored how organizations must become more adaptive, build AI-native capabilities, and ...


|
AI & DATA STRATEGY
|
 |
|
Synaptiq helps you develop your AI and data strategy as well as accelerate your roadmap to achieve successful business outcomes. Assess your AI and data readiness so you can prioritize the gaps you need to fill.
|
| Read More ⇢ |
|
DATA LAKE
|
 |
|
Synaptiq helps you unify structured and unstructured data into a secure, compliant data lake that powers AI, advanced analytics and real-time decision-making across your business.
|
| Read More ⇢ |
|
AI AGENTS & CHATBOTS
|
 |
|
Synaptiq helps you create AI agents and chatbots that leverage your proprietary data to automate tasks, improve efficiency, and deliver reliable answers within your workflows.
|
| Read More ⇢ |
|
LEGAL SERVICES
|
 |
|
Learn how Synaptiq helped a law firm cut down on administrative hours during a document migration project.
|
| Read the Case Study ⇢ |
|
GOVERNMENT/LEGAL SERVICES
|
 |
|
Learn how Synaptiq helped a government law firm build an AI product to streamline client experiences.
|
| Read the Case Study ⇢ |
 |
|
Mushrooms, Goats, and Machine Learning: What do they all have in common? You may never know unless you get started exploring the fundamentals of Machine Learning with Dr. Tim Oates, Synaptiq's Chief Data Scientist. You can read and visualize his new book in Python, tinker with inputs, and practice machine learning techniques for free. |
| Start Chapter 1 Now ⇢ |


High-Dimensional Data
Imagine a spreadsheet with one hundred columns and only ten rows. This is a high-dimensional dataset, in which the number of features (columns) matches or exceeds the number of observations (rows). In the context of data science and machine learning, managing high-dimensional data presents challenges. Models trained on high-dimensional data are difficult to interpret and tend to be computationally expensive and time-consuming to train.
The Curse of Dimensionality
The "curse of dimensionality," a term coined by the American mathematician Richard Bellman in 1961, refers to various problems that arise when organizing, analyzing, or otherwise dealing with data in high-dimensional spaces. Common issues associated with the curse of dimensionality include the following:

Dimensionality Reduction
One solution to the curse of dimensionality is dimensionality reduction — the transformation of data from a high-dimensional space into a lower-dimensional space. Dimensionality reduction techniques aim to reduce the number of features in a dataset without muddying the essential characteristics of the data, which are those that convey useful information. Simply put, these techniques aim to remove the noise from a dataset but preserve the signal.
Principal component analysis (PCA) is a dimensionality reduction technique that transforms data from a high-dimensional space into a low-dimensional space by condensing the original features into a smaller number of principal components. These principal components are linear combinations of the original features specifically tailored to capture the greatest amount of variance (assumed to correspond to information) in the data.
The first principal component (a.k.a. PC1) captures the maximum amount of variance in the data. The second principal component (a.k.a. PC2) then captures the maximum amount of the variance left unexplained by PC1. Each subsequent principal component captures progressively less variance than its predecessor, decomposing the data into a new basis where the components are ranked according to their variance contribution.
The Upfront Computational Cost of PCA
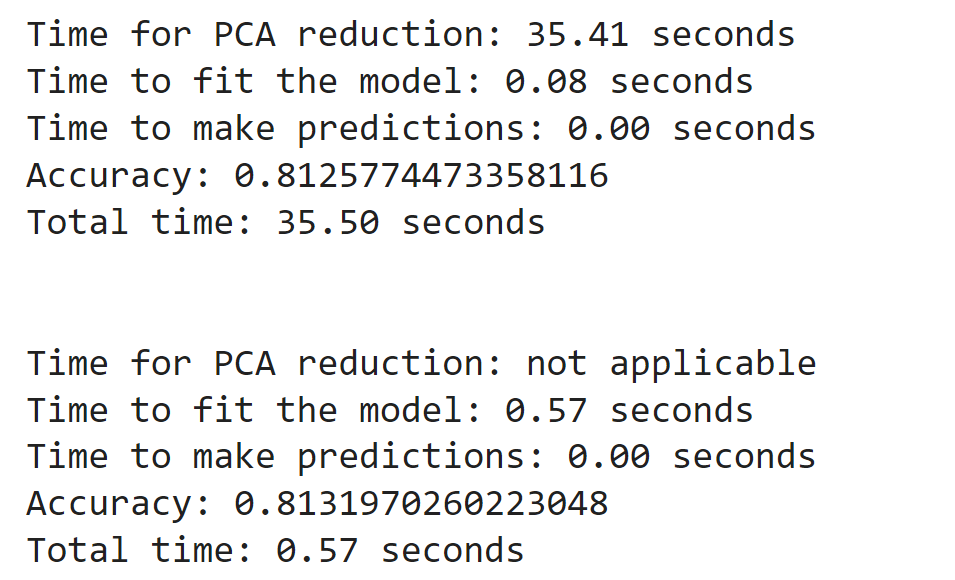
Principal component analysis involves operations that scale with the square of the number of original features that need to be condensed. Consequently, PCA can be computationally intensive and time-consuming, especially when it’s applied to datasets with more than a few thousand original features. For example, applying PCA to our Sephora customer review dataset with 12 thousand original features takes 35.41 seconds.
![]()
The Downstream Benefits of PCA
The downstream benefits of PCA often justify the upfront computational expense. After we use PCA to condense our Sephora customer review dataset into one hundred principal components, fitting a logistic regression model to predict whether a review is negative or positive takes 0.08 seconds — versus 0.57 seconds required to fit the same model to the original features. Model training is often an iterative process, so this seemingly small reduction in training time can translate into significant cumulative efficiency gains across hundreds or thousands of iterations.
Note: The accuracy of both models is ~81 percent. This suboptimal performance could stem from the limitations of our TF-IDF matrix, which overlooks semantic meaning, i.e. the contextual significance of word order. In an upcoming blog post, we will explore a solution to this oversight: word embeddings. Word embeddings represent words as dense vectors in a continuous vector space, capturing not only their frequency but also their semantic meaning.
Our Sephora dataset is an extremely small fish in the grand scheme of machine learning and data science. Datasets used in many modern applications, from image recognition to natural language processing, can be much larger — often by several orders of magnitude. For example, consider autonomous driving systems like those developed by Tesla and Waymo. Dimensionality reduction techniques like PCA enable these systems to rapidly and continuously process high-dimensional datasets with many millions of original features.
In practice, this question is best left to experts. Dimensionality reduction techniques are not one-size-fits-all, requiring domain expertise to determine their suitability for a given scenario. But as a general rule of thumb, PCA is best employed when the goal is to simplify high-dimensional data while preserving as much variance as possible.
However, Several factors can render PCA unsuitable for a task or dataset. For instance, PCA is typically ineffective when the assumption that variance equates to information does not hold true, and it will often fail to capture non-linear relationships between original features. Moreover, if the time spent applying PCA outweighs the time saved in subsequent model training, it may not be worthwhile. Therefore, it's essential to evaluate task requirements and dataset characteristics before deciding on the suitability of PCA as a dimensionality reduction technique. Consulting with domain experts can help ensure the best approach is selected for the situation at hand.

Photo by Vanessa Schulze on Unsplash
Synaptiq is an AI and data science consultancy based in Portland, Oregon. We collaborate with our clients to develop human-centered products and solutions. We uphold a strong commitment to ethics and innovation.
Contact us if you have a problem to solve, a process to refine, or a question to ask.
You can learn more about our story through our past projects, our blog, or our podcast.